
Emergency Post!!
Markets in Turmoil!

I don’t even no where to begin putting into print all the ADHD thoughts running through my mind. I have so much wisdom, I am so smart, have been doing this for decades. Hell, I got my Securities license in May of 1987. So been there, done that. I am so smart, that I raised cash earlier this week, after all I am a market god, saw this coming. This was from Chat earlier this week…
But the reality of managing money is much more complicated than that. Today, a few hours into market trading, I actually nibbled on a few stocks that I want to build a position in. Fast forward to only an hour or two latter, and I not only sold what I bought this morning, but I started pairing back positions that I have been building for months. The more the market went down, the more I sold. Fast forward to the close, and even with the large cash position I came into today with (I think around 20%), and all the stocks I sized down in throughout the day, and I still ended up down 9% on the day. That’s real money, and that hurts. Mr. Market can be cruel, he doesn’t give a shit how smart I am. Mr. Market humbles me again, and again, time after time. It is blatantly obvious to me, that even after almost 40 years in the market, I still get humbled. I have learned some things along the way though, and these are the lessons that I hope to pass on to you. Old me might look at a stock I know to be a homerun one year out (AAOI as example), and try to revenge trade.
‘Oh this stock was just 200, this drop is overdone, after all their going to be doing BILLIONS in revenue next year. I’m just going to keep adding and eventually i’ll be right!’
Could that be the right play? - Sure, no reason why today could be the bottom, and back off to the races. Could it be the wrong play? - Just as reasonable…I have no edge. There is a 50/50 chance that Monday is an up or down day (literally). But it doesn’t even need to be revenge trading to ruin a good thing. When I look back at my personal investing, more often than not, it was not greed (staying in to long or top ticking the market) that blew up my account, it was being to early. I was savvy enough when I was CIO at JackShu to have sidestepped the entire dot.com crash. But I subsequently blew it up by thinking we had bottomed, only to see it transform into a multi year bear market. For me, this has conditioned me to be overly cautious. That means I will never be the guy who catches the bottom. Could today be the bottom? absolutely! - but you won’t see me positioned for that. I’ll let people smarter (should we rally from here), and dumber (should we sell off more) create their amazing returns or losses. For me, being able to sleep comfortably is worth more than any portfolio outperformance I might be able to create flipping a coin. I am going to try and get through as many charts this weekend for you as possible, locating levels where I believe you are likely to find buyers, and sellers. These are areas for me where I generally look at areas of interest to possibly add, pair back, sell, or add.
On a separate note, one of the reasons I think I am astute at technical analysis is that I try (as best as possible) to remove any bull/bear bias from what I am seeing in a chart. Make what you want of the following, and hopefully you will be sleeping comfortably (as I will) like a baby this weekend, because you’ve had/used the tools we have been sharing here the past few months.
There’s hope, whether you look at the fundamental backdrop of the semi/AI trade and realize it is 150% accelerating and in excellent shape. You could also look back historically as to what the market has done in the past when we got smashed like this;
Now for some bearand bull porn…
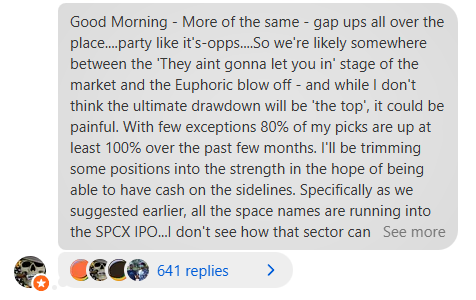
I am a big believer that the Korean’s have been driving a lot of this frenzy in the AI trade. I have read data points about people being all-in…leveraged to the hilt…buying this whole complex (SK Hynix/DRAM/MU/SNDK/Etc) at any price. While I don’t wish my Korean friends any ill-will, this does remind me of the Japanese buying up US trophy properties at any price in the 1990’s (?) which was the ultimate top. So one of the more important charts I am watching is the Kospi (EWY). While we’re down almost 20%, there is still room to move lower (not too much hopefully- possible channel support/233 MA confluence below).
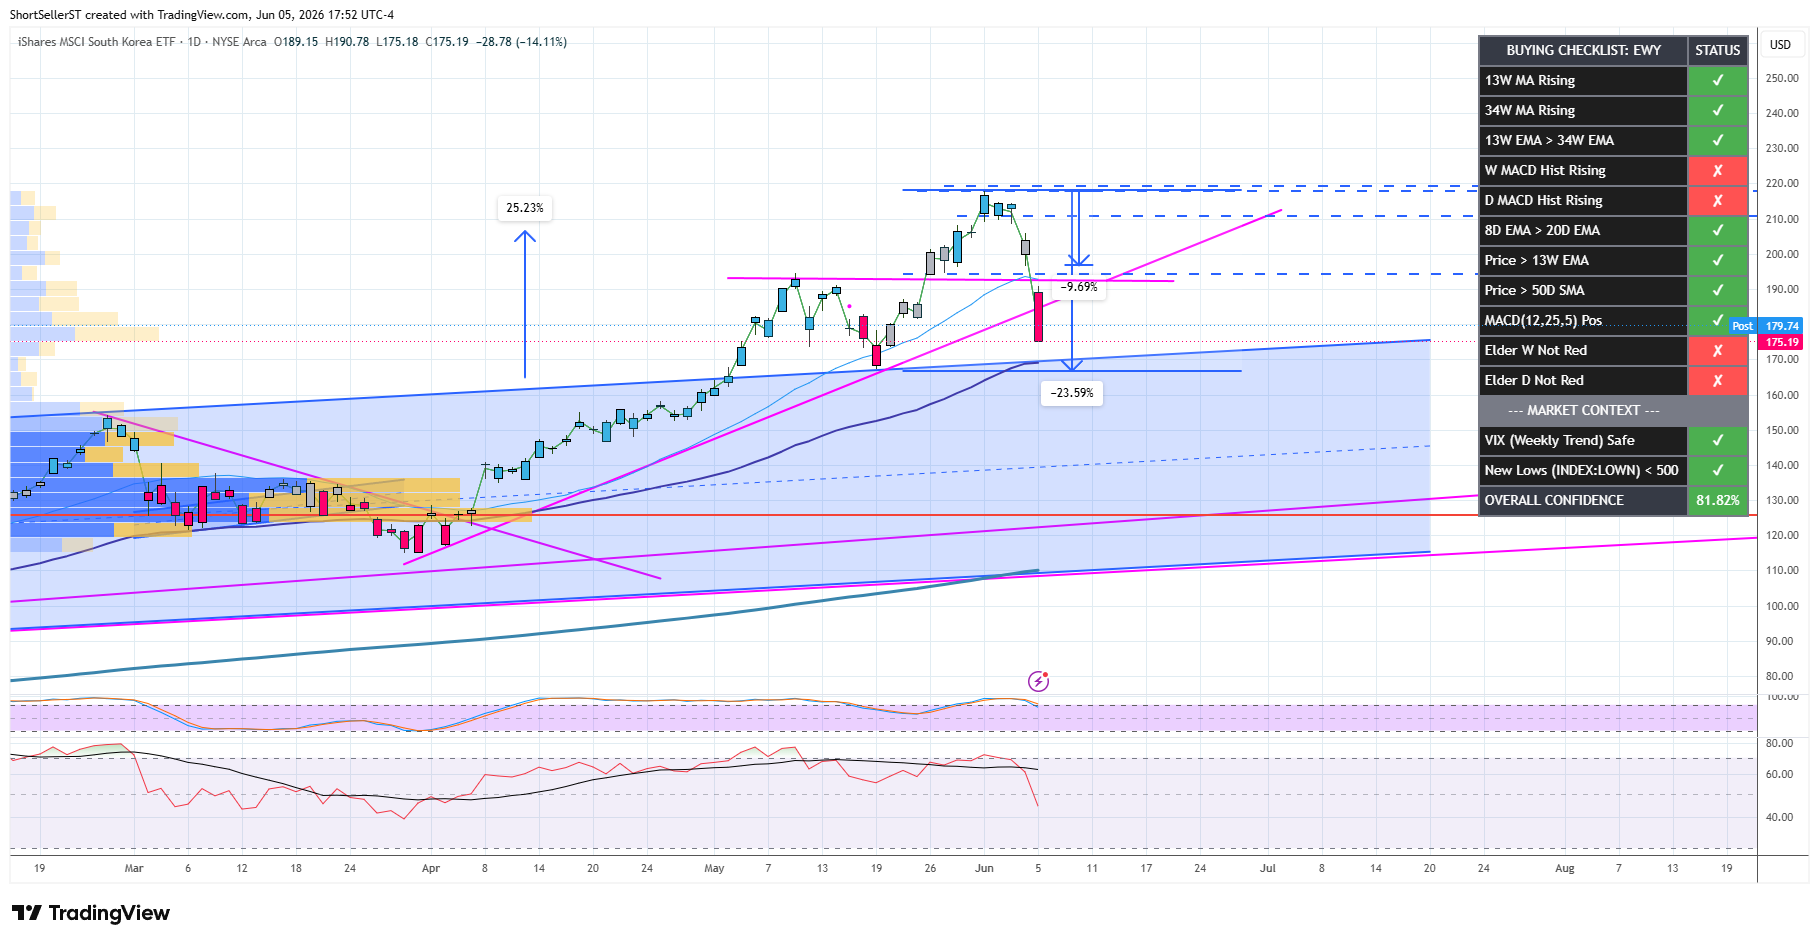
MU Currently down 20% from it’s highs (you know what I say about great TAM leaders when they’re down 20-35%) - likely bounces from oversold, but chart-wise has more room below to hit a ‘true’ support level
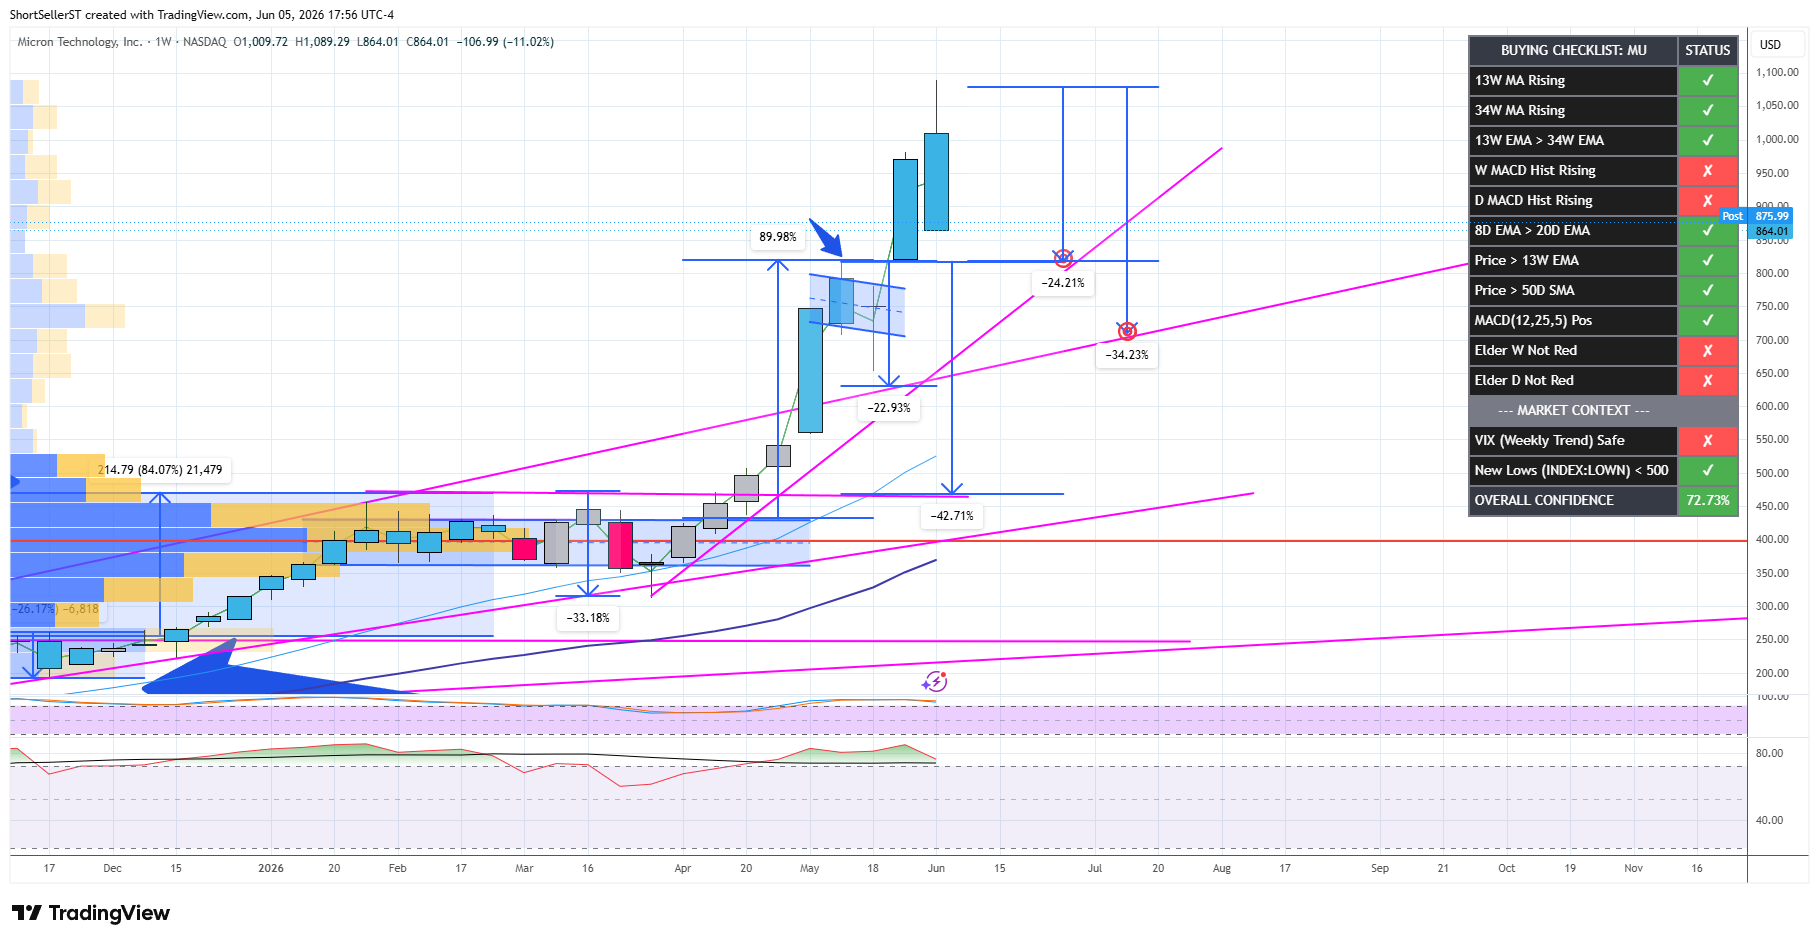
SNDK 20% drawdown from it’s highs - and this is the first level where I would nibble…lower bullseyes being other places to DCA
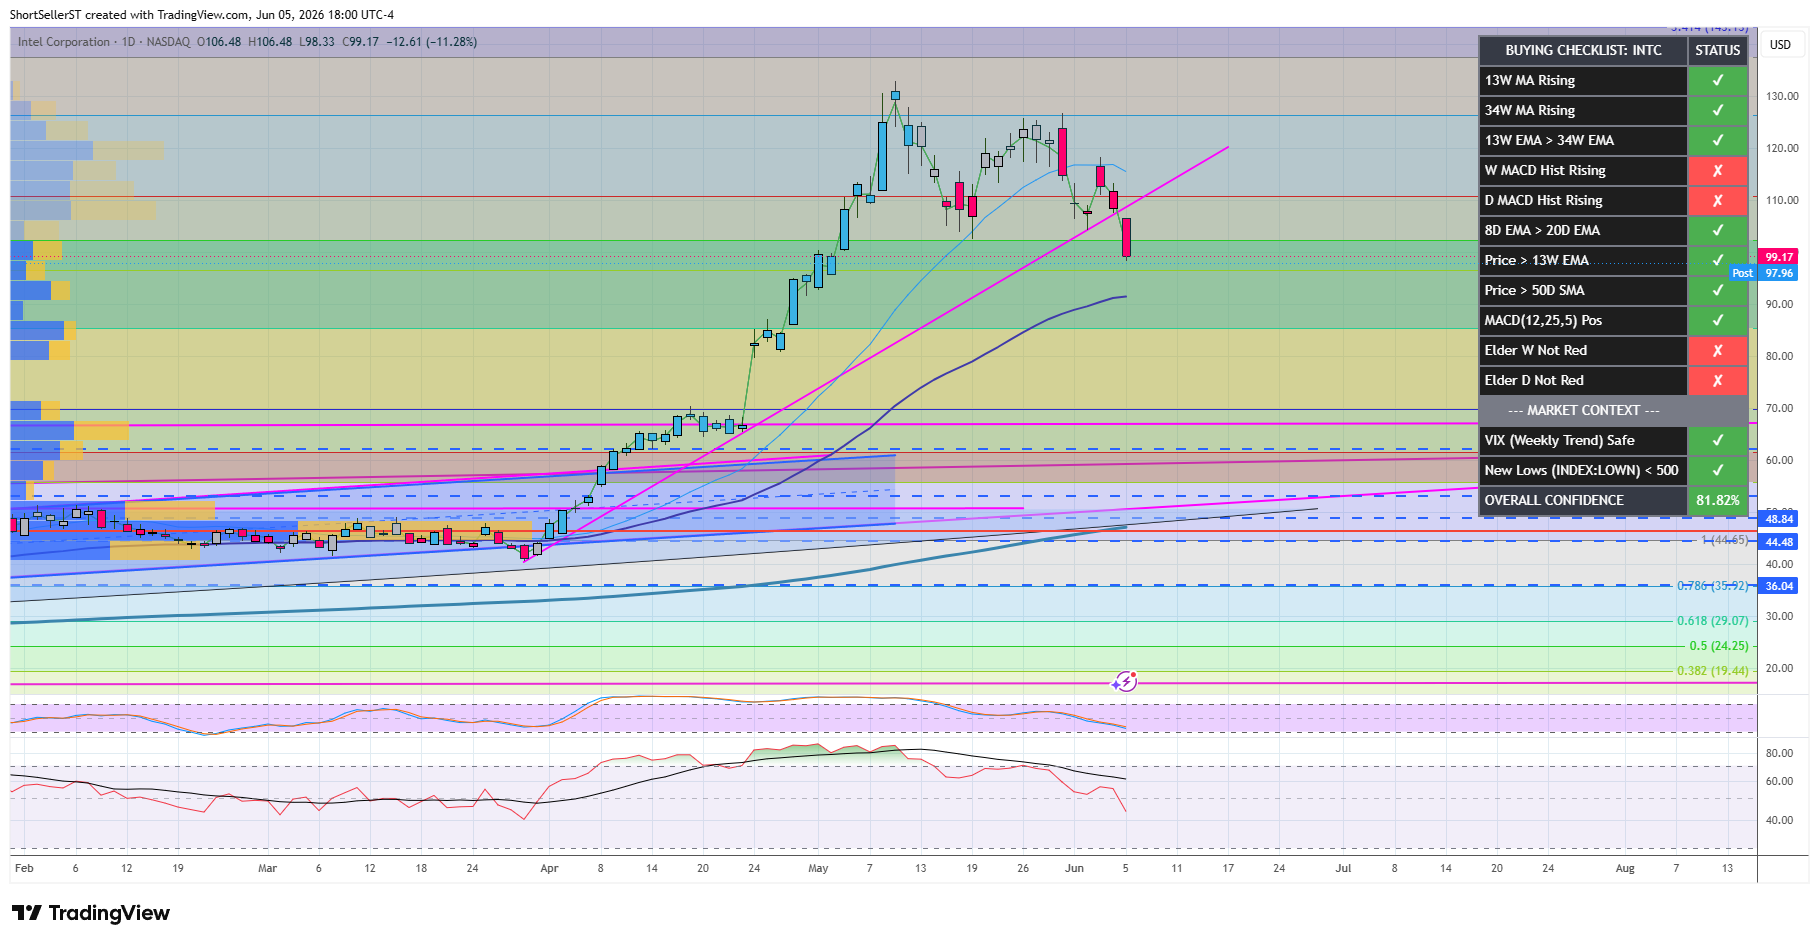
INTC daily…lost UTL and looks lower
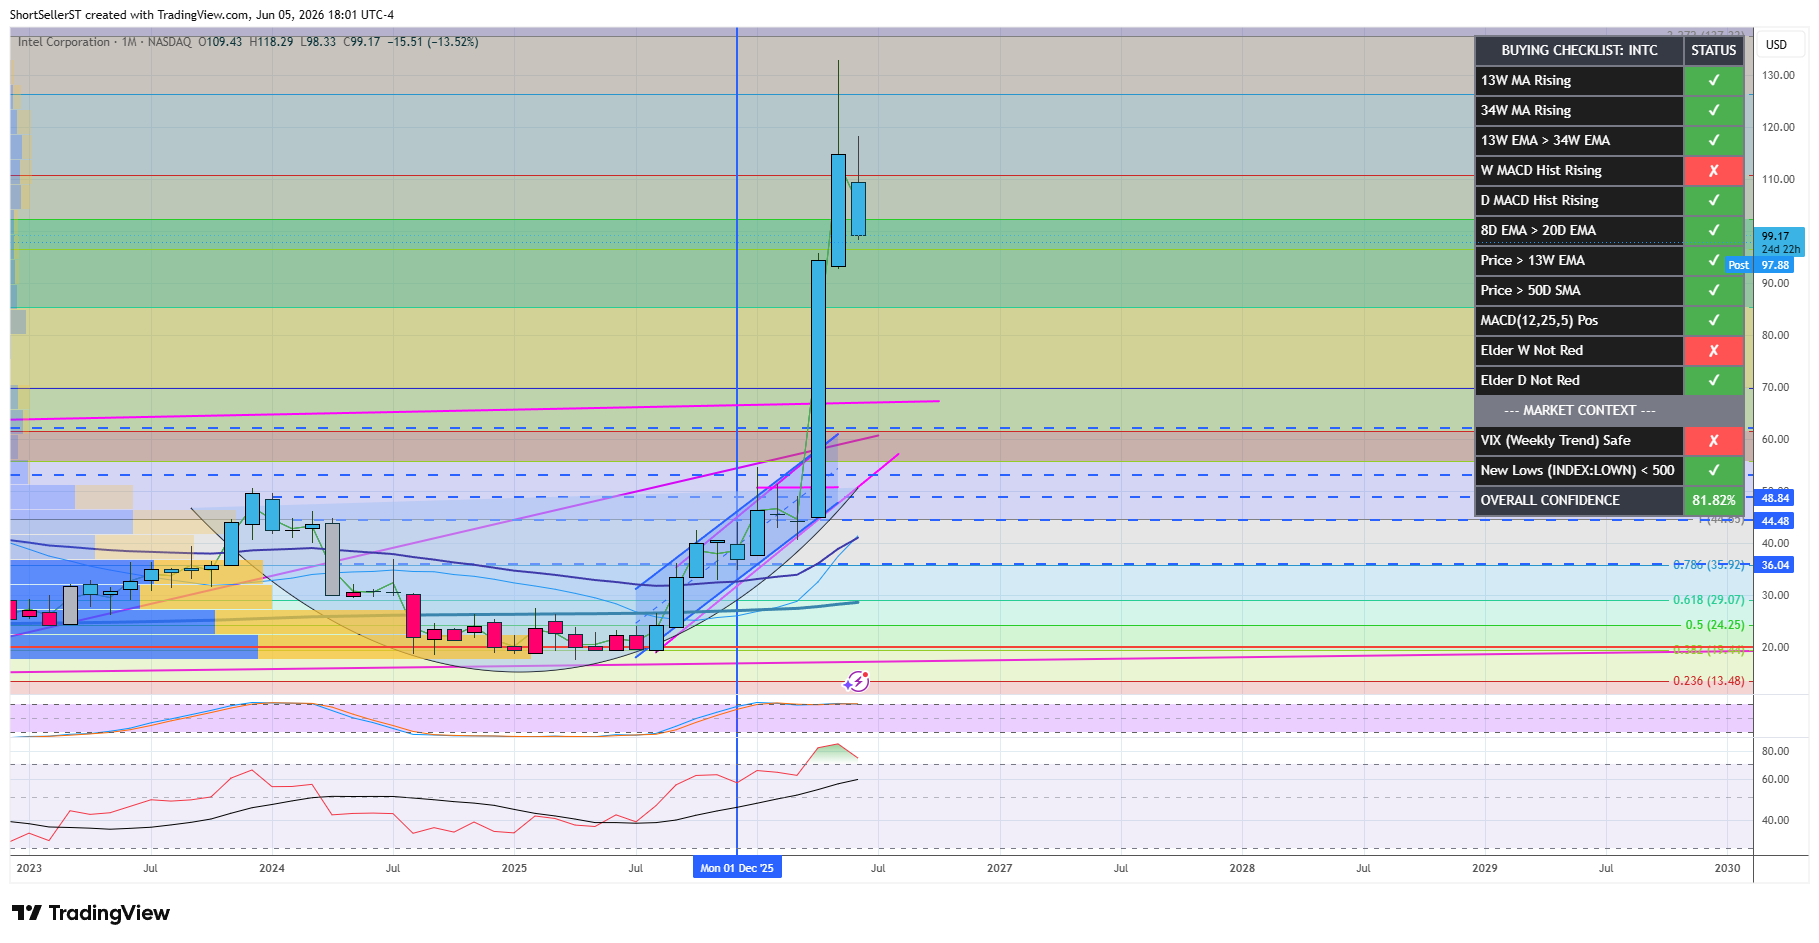
INTC Note monthly chart still inside candle suggestive (to me) that this correction is a buying opportunity and not a top (92 being an important monthly close)
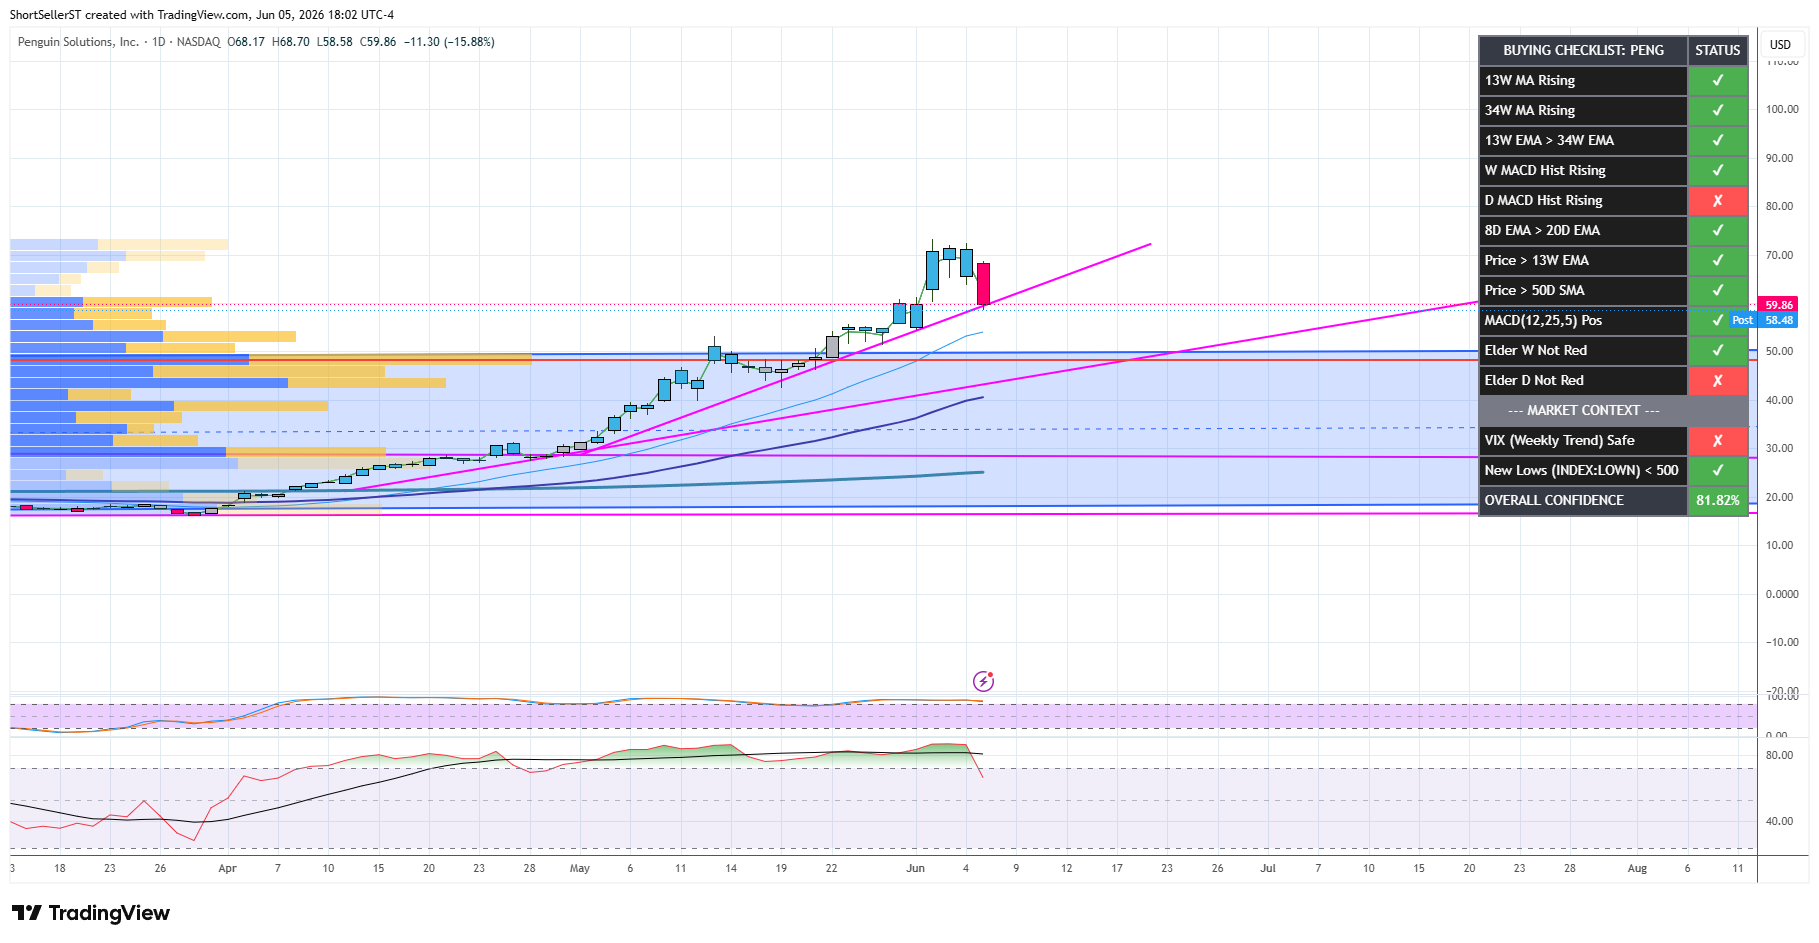
PENG daily…Will put this in the positive camp for now, as it is holding it’s daily TL
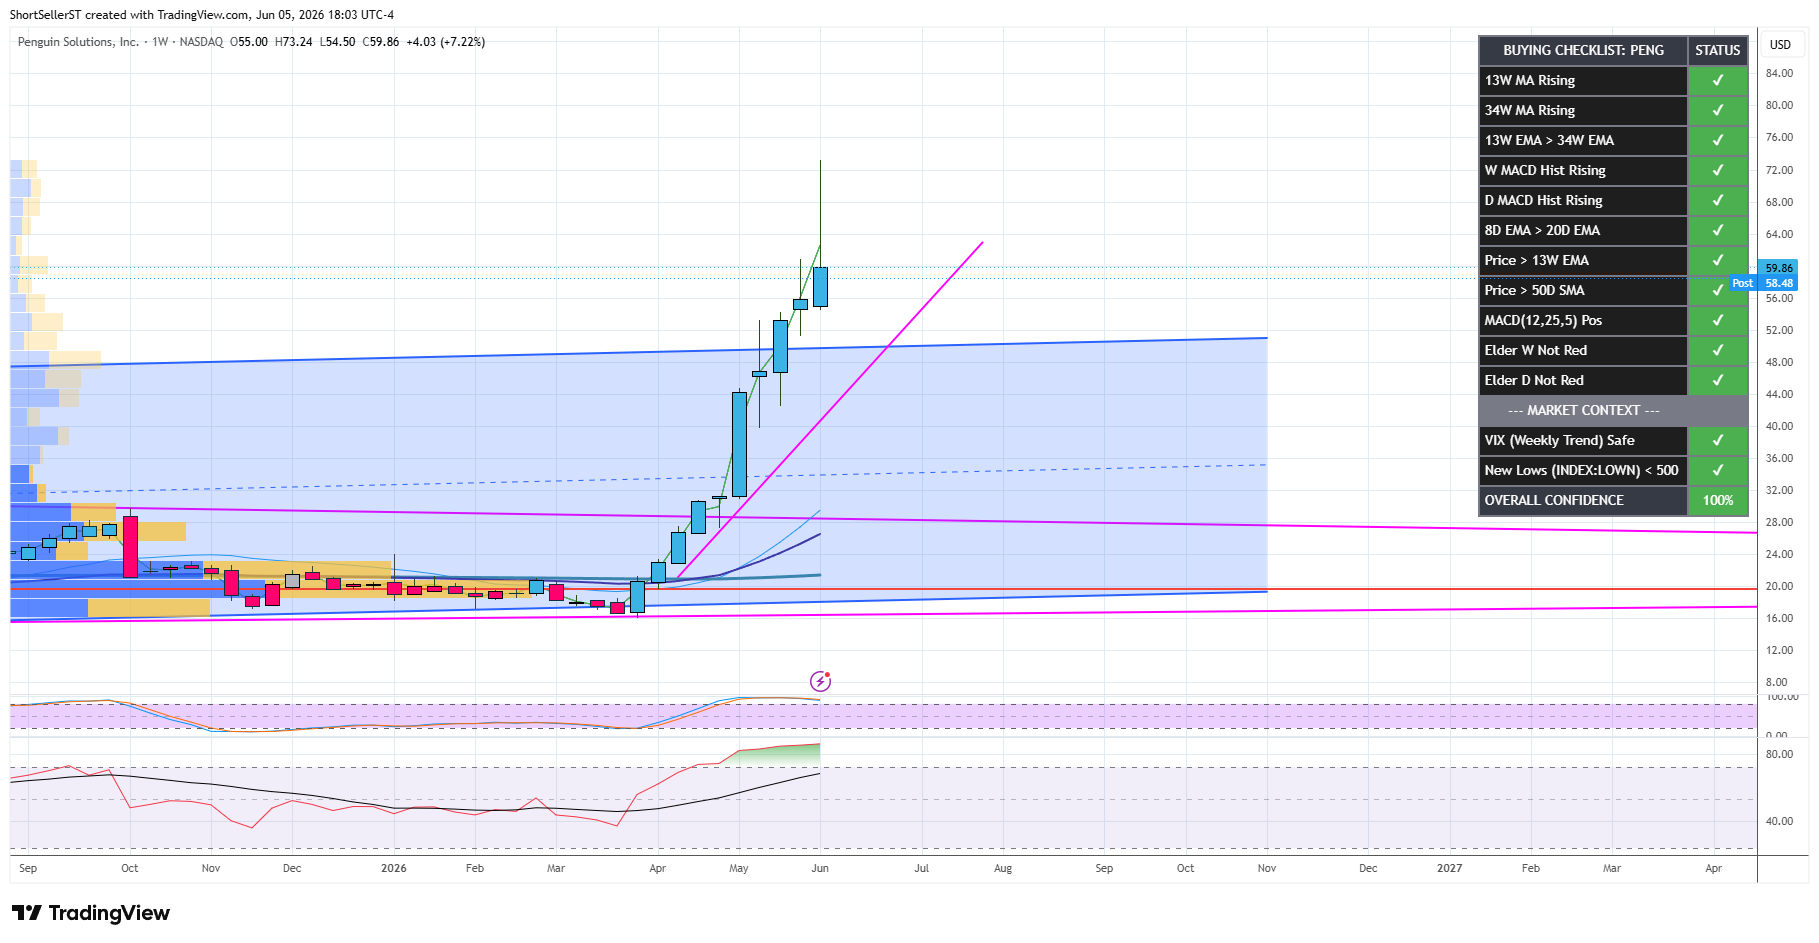
However when we look at the weekly (as with most of the Semi’s), that’s a toppy looking candle (long wick)
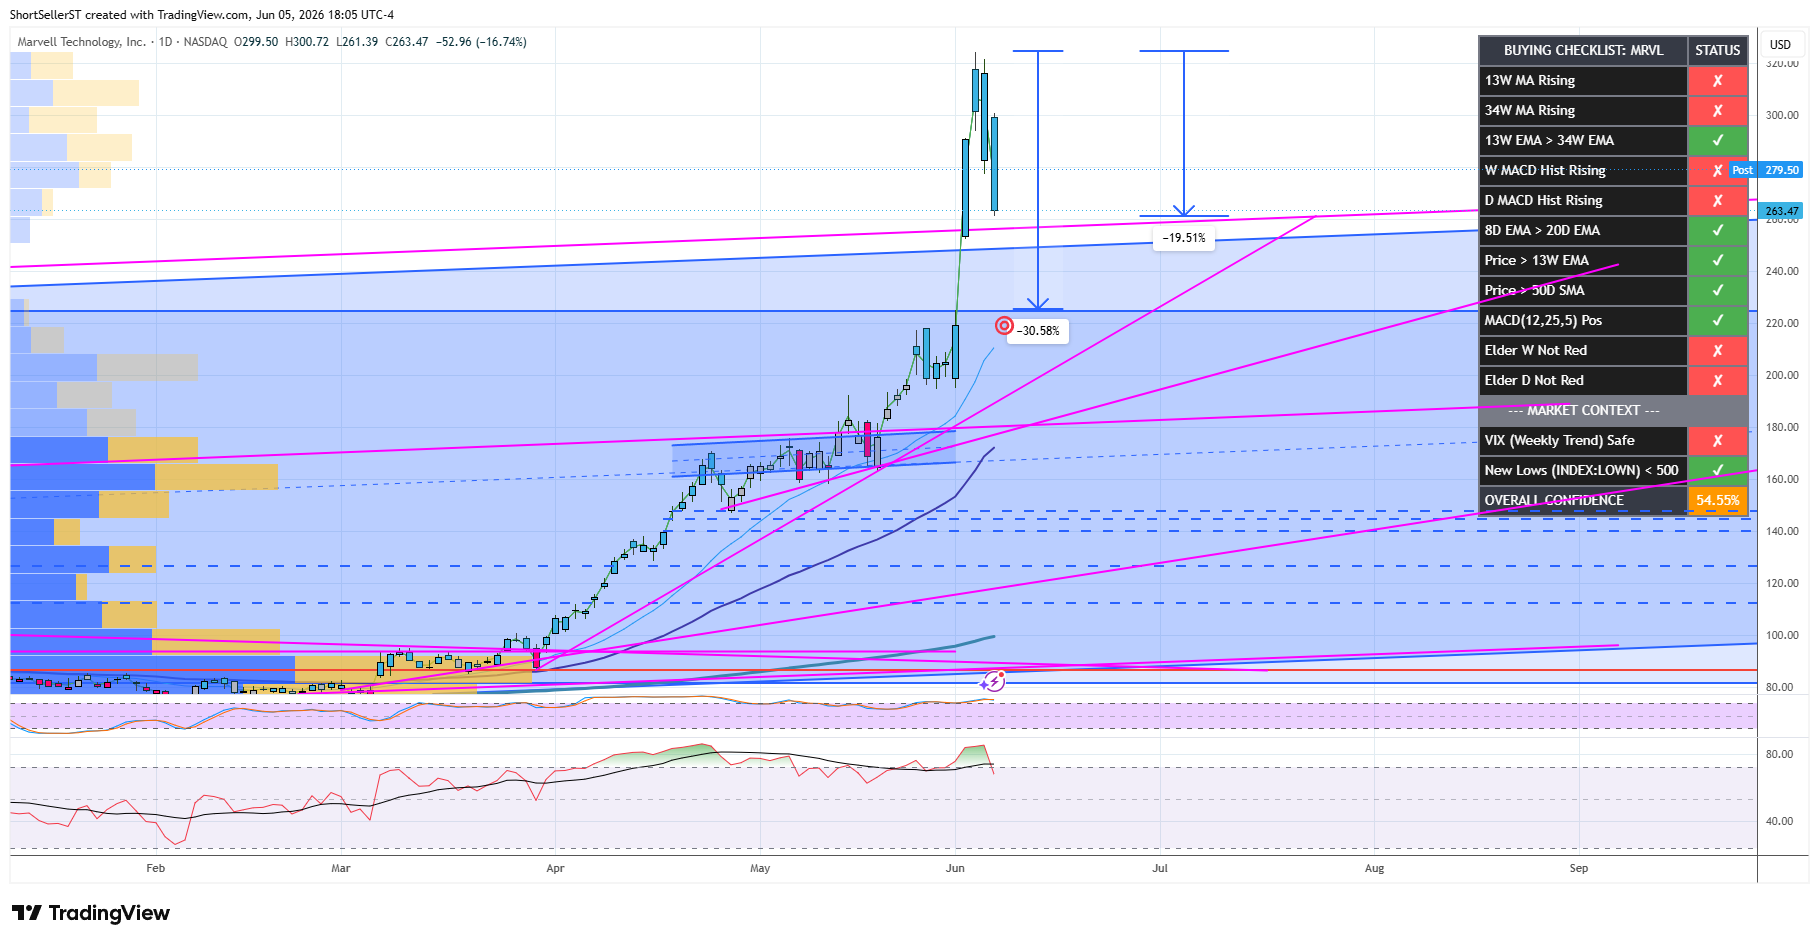
MRVL daily - extended off it’s primary trend but at an almost 20%A drawdown…a 30% drawdown would close that gap below…
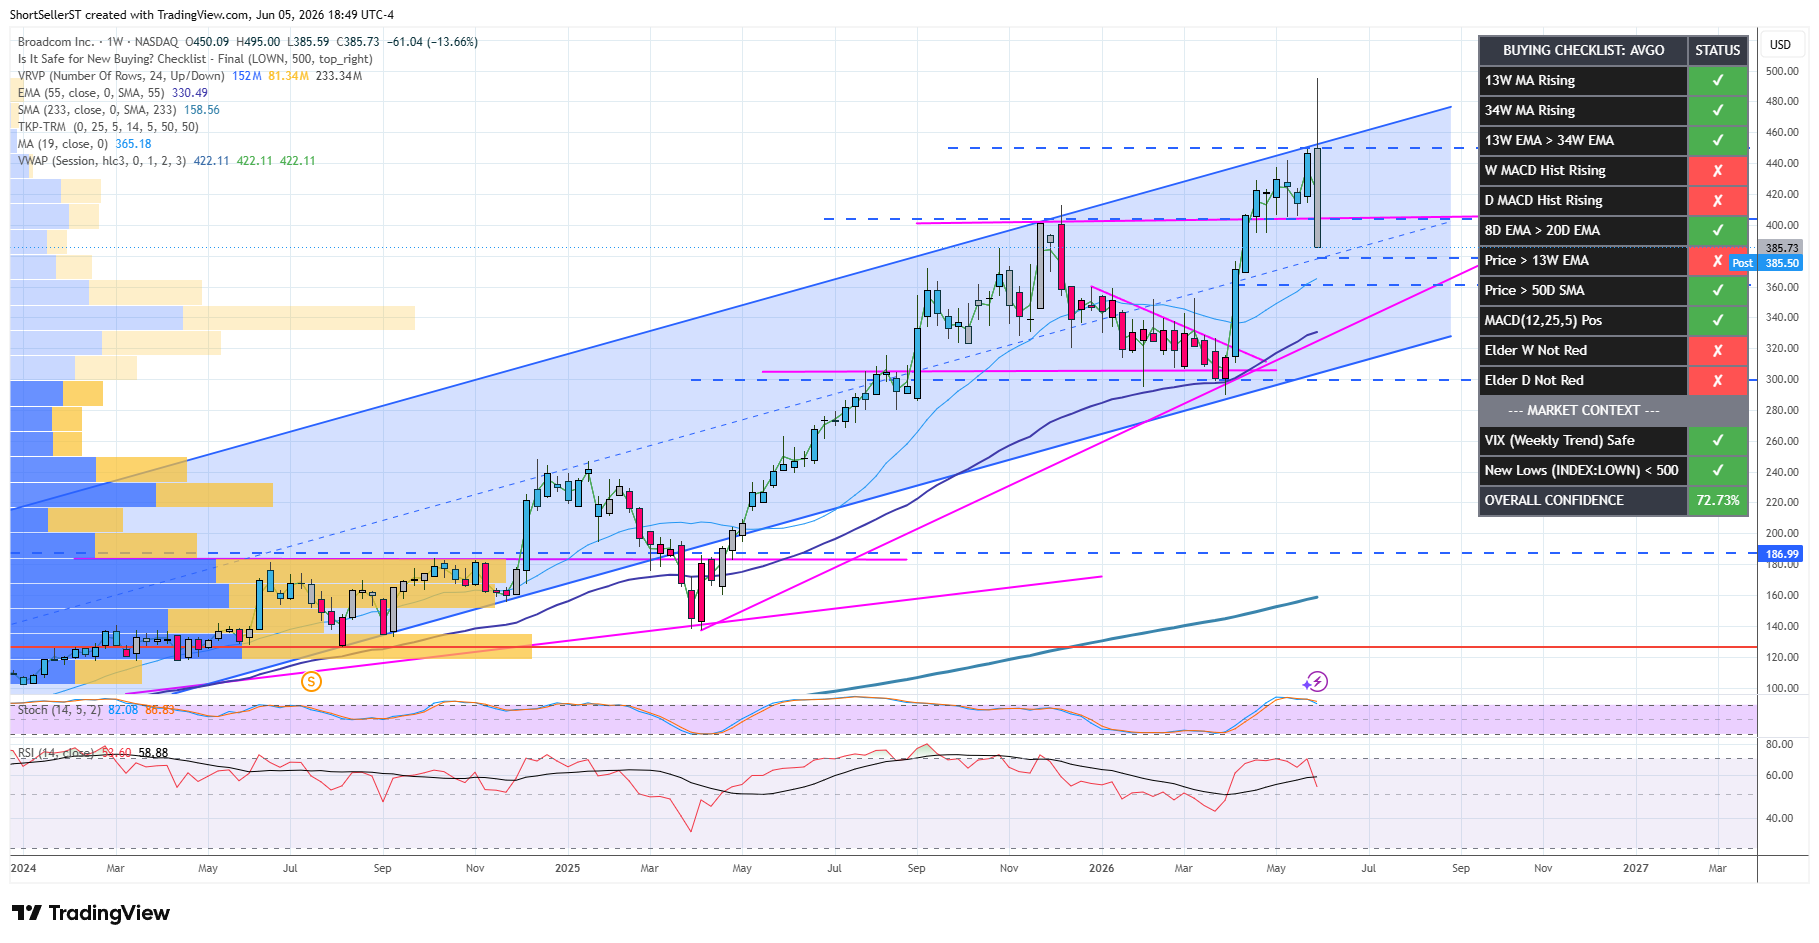
AVGO Retested (and failed) to hold it’s earlier ATH
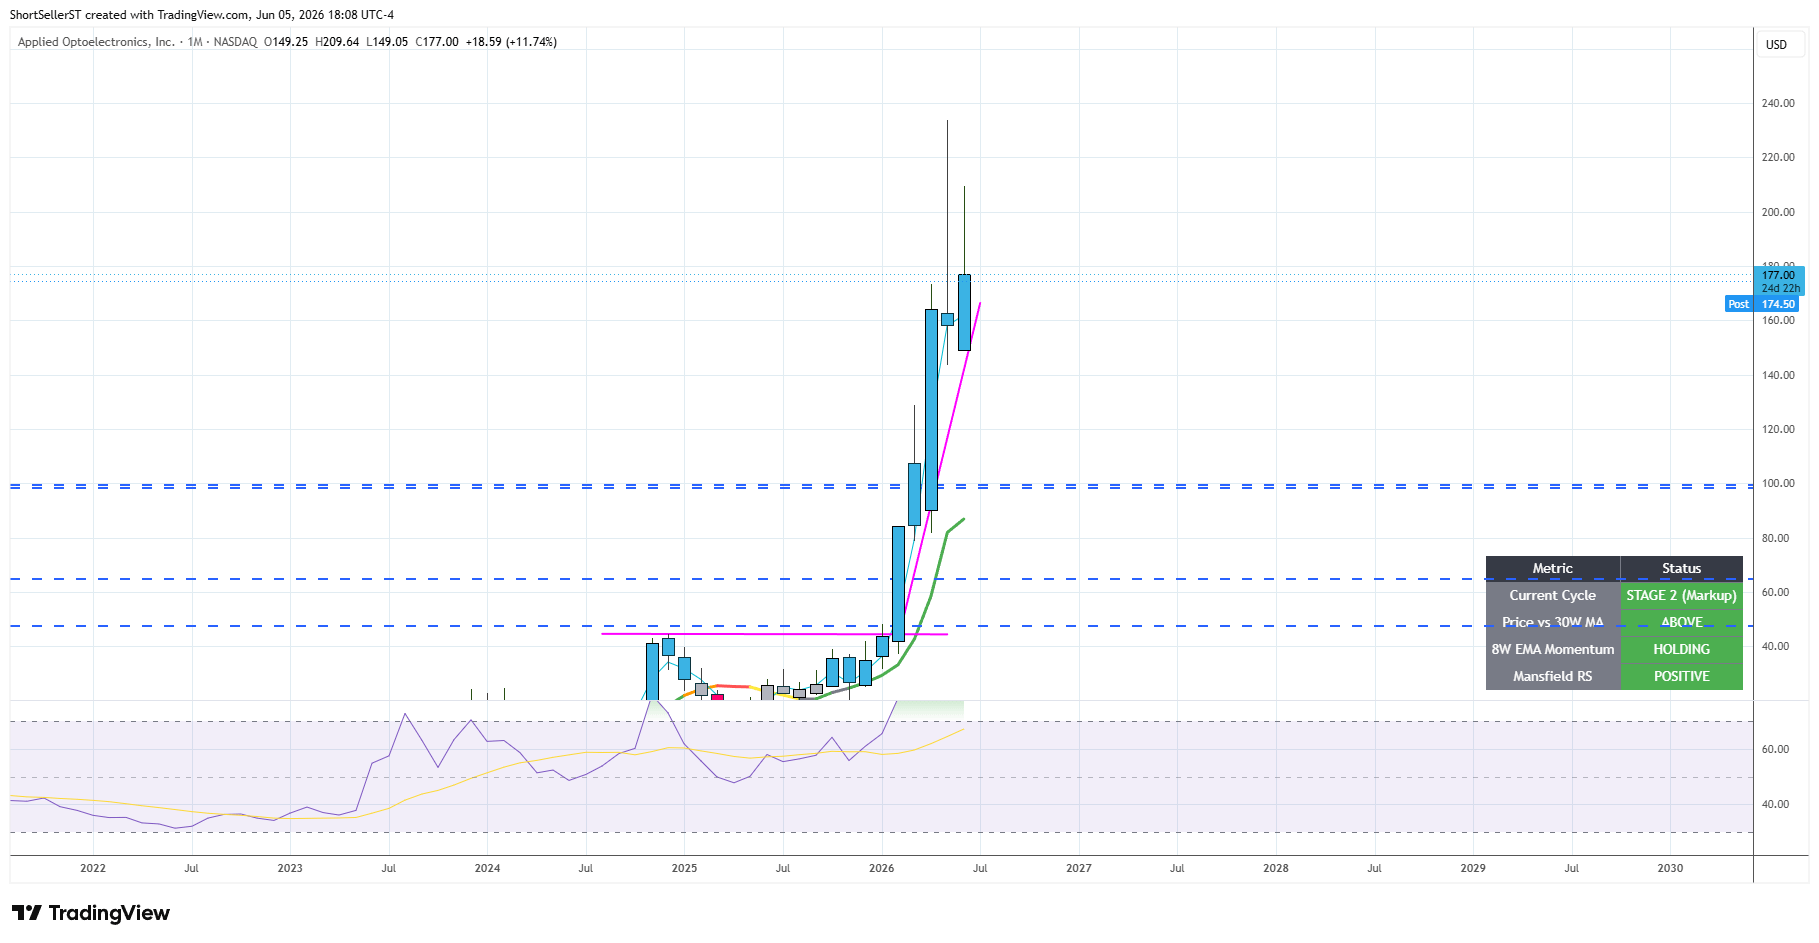
AAOI As crappy as the monthly candle looks - this months follow up so far ok…my gut thinks this will be the horse to bet on coming out of the correction…
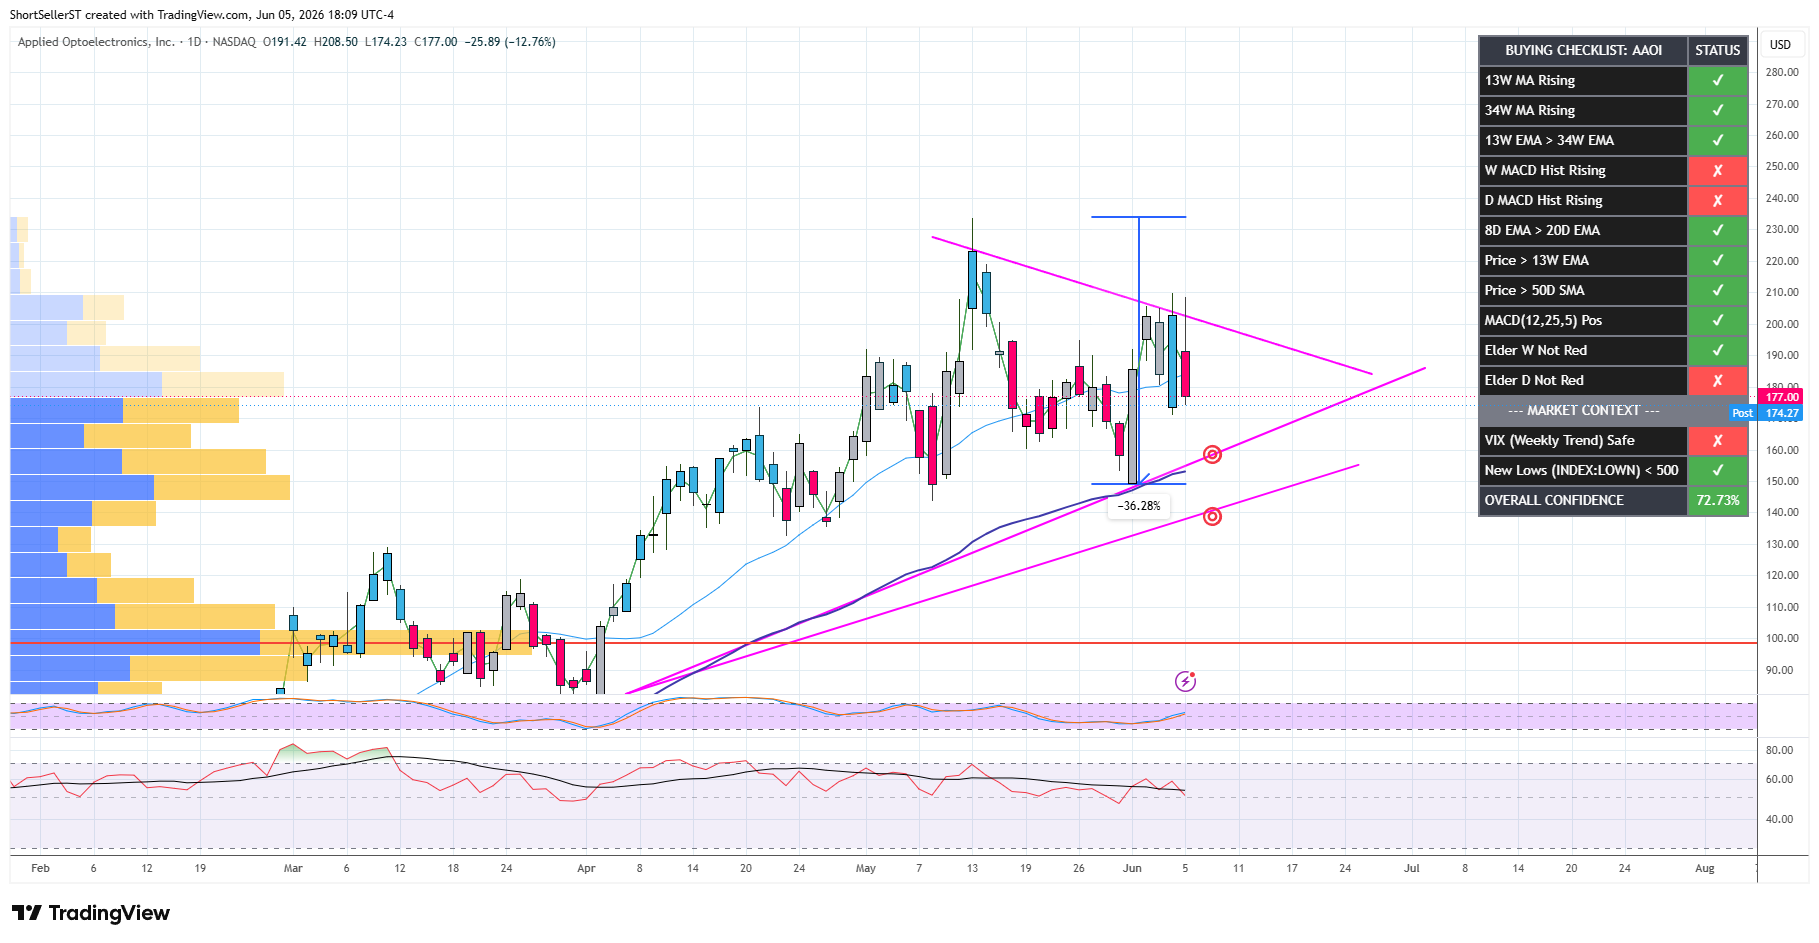
AAOI daily - inside candle is impressive - Photonics > general AI semi’s IMO
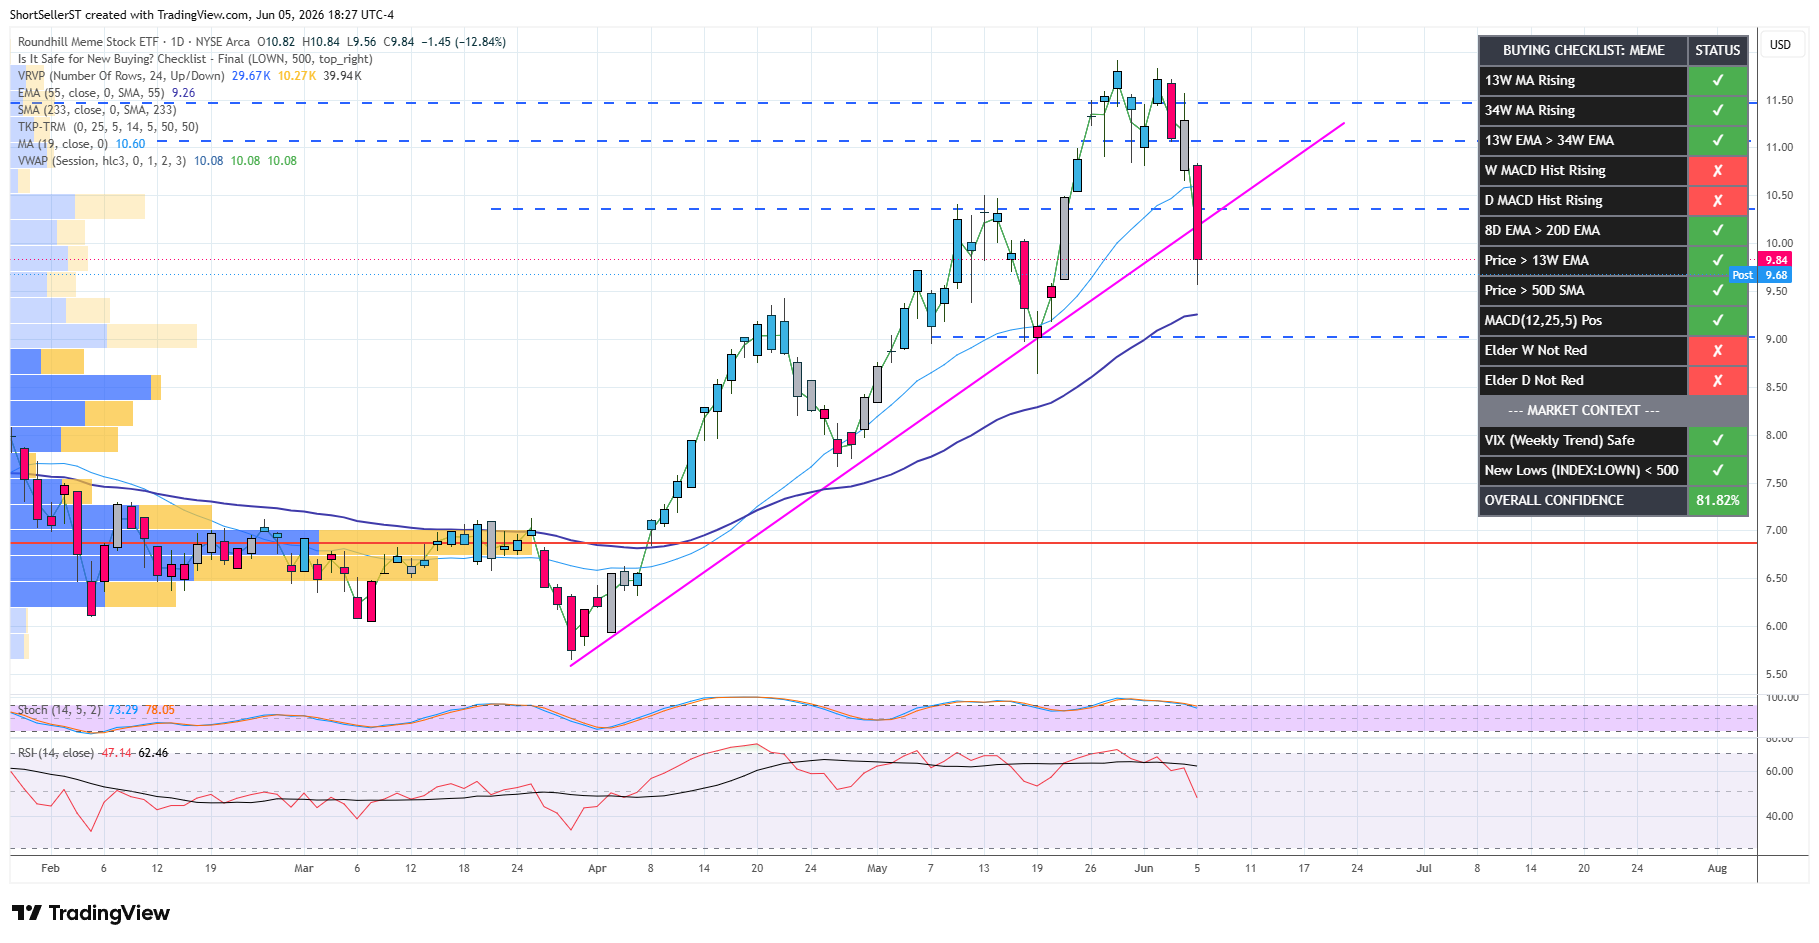
MEME - Suggestive of risk off
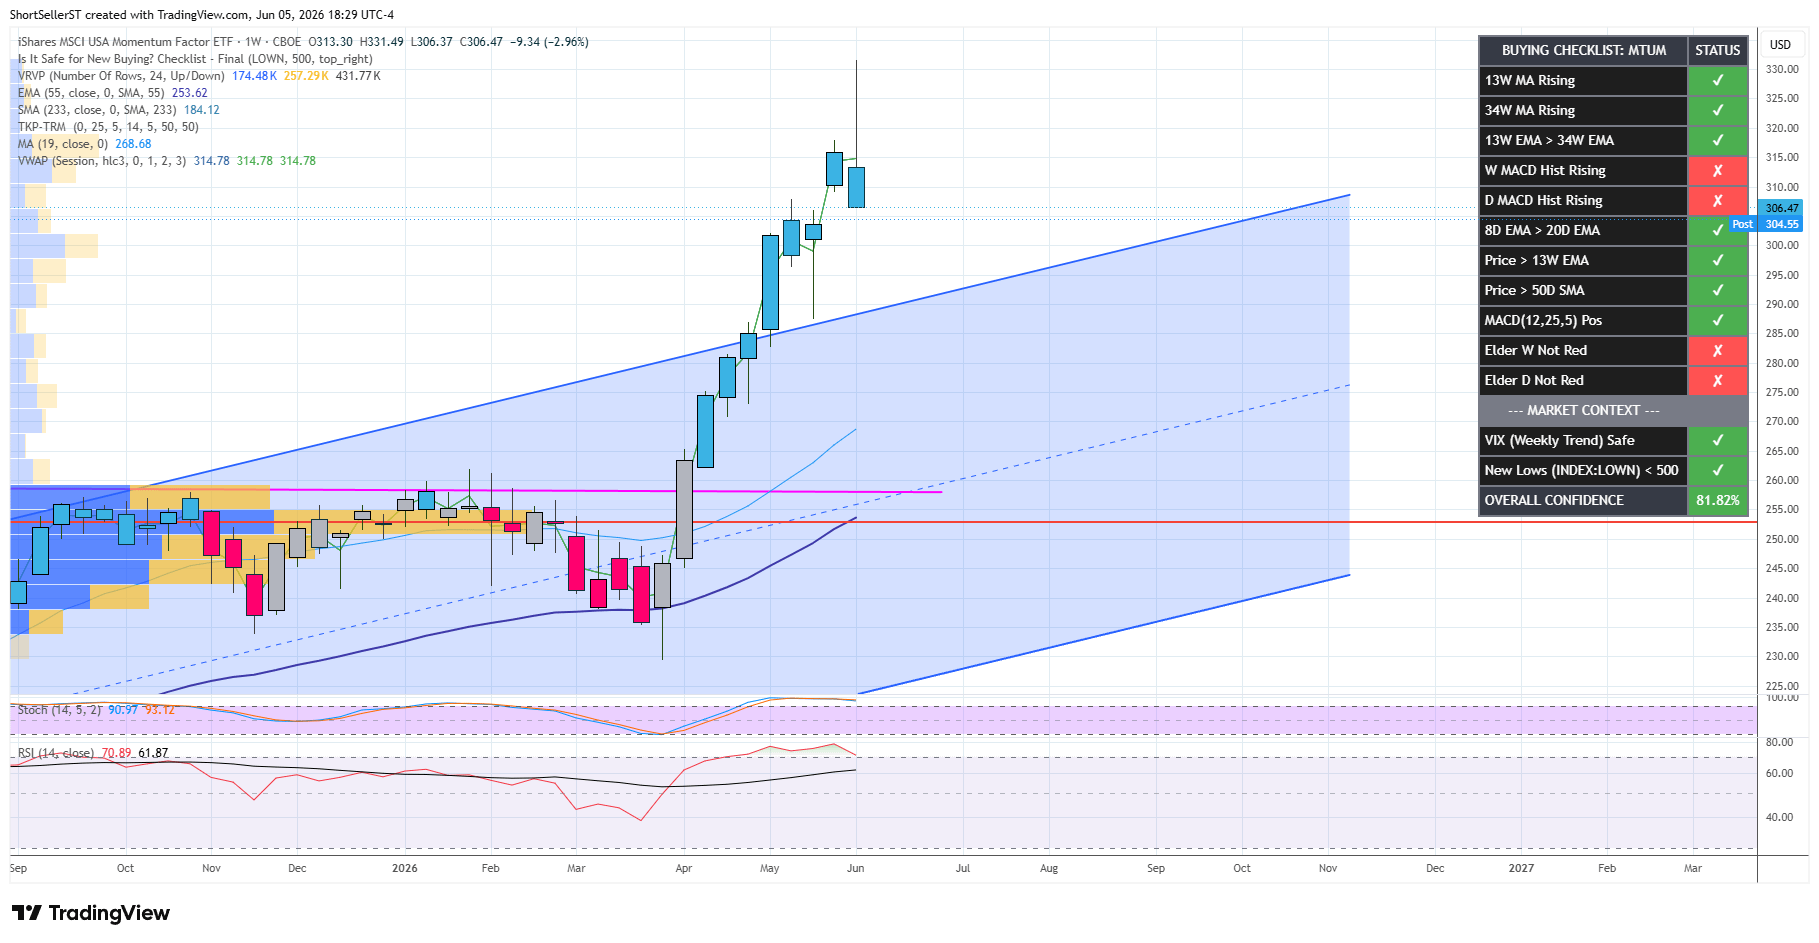
MTUM Weekly topping candle suggestive of risk off
BTCUSD Huge risk on/risk off level (monthly chart so candle not closed)

I could do this all night….but the larger point is I just don’t know….so am cautious right now….I will try to put up as many charts this weekend as possible annotated with my buy (sell?) levels as I can get to. Now for some AI slop
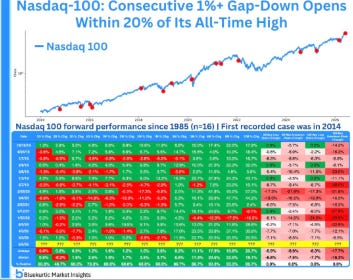
Historically (using QQQ daily data as a close proxy for Nasdaq performance from 2003–June 2026), there have been 18 Fridays where the Nasdaq (tracked via Nasdaq-100 ETF QQQ) dropped more than 3%.
These events are relatively rare and tend to cluster during volatile periods (e.g., 2015–2016 corrections, 2018 selloff, 2020 COVID crash, 2022 bear market, and more recently in 2025). The most recent one was June 5, 2026 (down ~4.8% on QQQ, aligning with the broad Nasdaq ~3–4% drop referenced in recent market action).
For the 17 instances with full forward data available, here’s what happened after those big-down Fridays (all returns are close-to-close, forward from the Friday close; next trading day after Friday is almost always Monday):
Following Monday (next trading day):
Average: -0.18%
Median: +0.12%
Win rate (positive): 52.9%
Range: -4.65% to +3.64%
(Slightly mixed, but more often flat-to-positive than deeply negative.)1 week later (5 trading days forward):
Average: +1.39%
Median: +1.38%
Win rate: 52.9%
Range: -4.90% to +8.55%2 weeks later (10 trading days forward):
Average: +3.09%
Median: +3.54%
Win rate: 76.5% (strongest rebound window)
Range: -8.56% to +9.57%3 weeks later (15 trading days forward):
Average: +3.52%
Median: +4.46%
Win rate: 64.7%
Range: -7.84% to +18.94%4 weeks later (20 trading days forward):
Average: +4.64%
Median: +3.43%
Win rate: 58.8%
Range: -10.76% to +24.63%
Key takeaway: After sharp Friday drops >3%, the Nasdaq has shown a mild-to-moderate bullish bias on average over the next 1–4 weeks, with the highest win rate and solid positive skew at the 2-week mark. Mondays are roughly a coin flip (slightly better than 50/50). There is meaningful variability—some rebounds are strong, but occasional further weakness occurs (especially in ongoing bear markets). Past performance doesn’t guarantee future results, and this is a small sample (only 17–18 events), so it’s a tendency, not a rule.
The specific Friday dates (QQQ > –3% drops) were:
2015-08-21, 2016-01-15, 2016-02-05, 2016-06-24, 2018-12-07, 2018-12-21, 2019-08-23, 2020-03-20, 2020-03-27, 2022-02-11, 2022-04-29, 2022-06-10, 2022-08-26, 2022-10-07, 2022-10-14, 2025-04-04, 2025-10-10, and 2026-06-05.
This analysis uses verified historical daily bars; QQQ closely tracks the Nasdaq-100 (the main driver of “Nasdaq” headline moves), so the pattern is highly representative of the broader Nasdaq Composite behavior on large down days.
And some historical random comparisons…
The AnnualizeThis Substack is all about trying to locate 10X’ers, and giving you the tools and 1000’s of charts to help you accomplish that. But it’s so much more than that. Learn from the mistakes I have made over almost 4 decades of investing. I hope you consider becoming a subscriber. The price of a lifetime subscription is likely will pay you immediately, and ultimately in spades.
I suspect multitude of things. Run on semis over done, possible market sniffing post war. Why large drop in commodities?
Are you short anything?